


Springboot And Minikube : Deployment, Monitoring and Logging
Ingress Gateway: Simple fanout
Student Service
Rating Service
Requirements
Java: JDK 1.8
Maven Build
Docker
Kubernetes: Minikube on local
Part 1 Deployment
Build Student Service
$ cd rating-service
$ mvn package
Create docker images for Student Service and push Docker Hub
$ cd student-service
$ docker build -t  ashishkamat2791/student-service .
$ docker push ashishkamat2791/student-service
Build Rating Service
$ cd rating-service
$ mvn package
Create docker images for Rating Service and push Docker Hub
$ cd rating-service
$ docker build -t ashishkamat2791/rating-service .
$ docker push ashishkamat2791/rating-service
Start Minikube
$ minikube start --cpus=8 --memory=12000 (needed to deploy ELK stack)
Create student-service deployment
$ cd devops/deployment
$ kubectl create -f deployment-student.yml
Create rating-service deployment
$ cd devops/deployment
$ kubectl create -f deployment-rating.yml
Create and Expose student-service
$ kubectl expose deployment student-service --type=NodePort
or
$ cd devops
$ kubectl create -f service-student.yml
Create and Expose rating-service
$ kubectl expose deployment rating-service --type=NodePort
or
$ cd devops
$ kubectl create -f service-rating.yml
Check service
$ minikube service student-service --url
Give me url http://192.168.99.100:30676 and Check rest-api 192.168.99.100:30676/hi
$ kubectl describe service student-service
Ingress Controller
Create Ingress
Create Ingress
$ cd devops
$ kubectl create -f ingress.yml
Check Ingress
For student
curl -v http://192.168.64.11/student/hi
For rating
curl -v http://192.168.64.11/rating/check
Enable Ingress
$ minikube addons enable ingress
$ minikube ip
1192.168.64.11
Part 2 : Monitoring
create namespace monitoring
$ kubectl create ns monitoring
Deploy prometheus
$ cd devpos/monitoring
$ helm install prometheus -f  prometheus/values.yml stable/prometheus  --namespace monitoring
Deploy configmap for autoconnect prometheus
$ cd devops/monitoring
$ kubectl apply -f grafana/config.yml
Deploy Grafana
$ cd devops/monitoring
$ helm install  grafana -f  grafana/values.yml stable/grafana  --namespace monitoring
Get Grafana password (username: admin)
kubectl get secret \
    --namespace monitoring grafana \
    -o jsonpath="{.data.admin-password}" \
    | base64 --decode ; echo
Access Grafana
$ export POD_NAME=$(kubectl get pods --namespace monitoring -l "app=grafana,release=grafana" -o jsonpath="{.items[0].metadata.name}")
$ kubectl --namespace monitoring port-forward $POD_NAME 3000
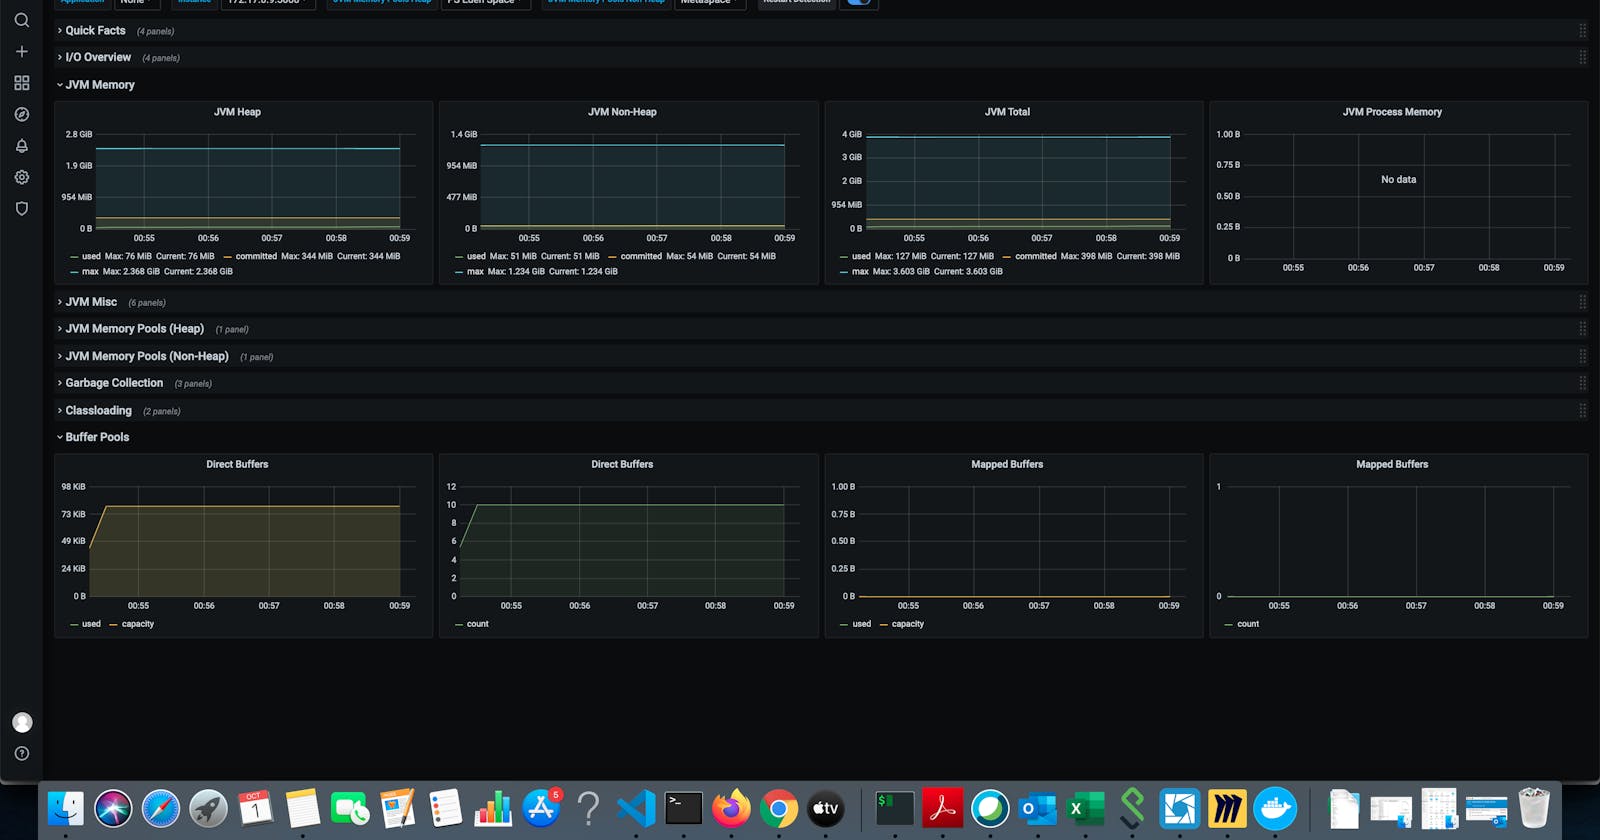
after login add following dashboard grafana.com/grafana/dashboards/4701
Part 3: Logging
adding elastic repo
helm repo add elastic https://Helm.elastic.co
1. creating elastic-search cluster
$ cd devops/logging
$ helm install elasticsearch elastic/elasticsearch -f elasticsearch/values.yaml -n logging
wait till you get this
kubectl get pods -n logging
NAME                     READY   STATUS    RESTARTS   AGE
elasticsearch-master-0   1/1     Running   0          3m35s
elasticsearch-master-1   1/1     Running   0          3m35s
elasticsearch-master-2   1/1     Running   0          3m35s
test elasticsearch is up
kubectl port-forward svc/elasticsearch-master 9200
You should get something like below in response
{
  "name" : "elasticsearch-master-2",
  "cluster_name" : "elasticsearch",
  "cluster_uuid" : "VHplAoI1RdOXU3s74J8YOA",
  "version" : {
    "number" : "7.9.2",
    "build_flavor" : "default",
    "build_type" : "docker",
    "build_hash" : "d34da0ea4a966c4e49417f2da2f244e3e97b4e6e",
    "build_date" : "2020-09-23T00:45:33.626720Z",
    "build_snapshot" : false,
    "lucene_version" : "8.6.2",
    "minimum_wire_compatibility_version" : "6.8.0",
    "minimum_index_compatibility_version" : "6.0.0-beta1"
  },
  "tagline" : "You Know, for Search"
}
2. Deploy Kibana
helm install kibana elastic/kibana -n logging
wait till you get this
k get pods -n logging
NAME                             READY   STATUS    RESTARTS   AGE
elasticsearch-master-0           1/1     Running   0          12m
elasticsearch-master-1           1/1     Running   0          12m
elasticsearch-master-2           1/1     Running   0          12m
kibana-kibana-696f869668-jrnvw   1/1     Running   0          6m10s
3. Deploy Filebeat
helm install filebeat elastic/filebeat -n loggin
wait till you get this
kubectl get pods --namespace=logging -l app=filebeat-filebeat -w
NAME                      READY   STATUS    RESTARTS   AGE
filebeat-filebeat-kgnr4   0/1     Running   0          54s
filebeat-filebeat-kgnr4   1/1     Running   0          59s
create index pattern and discover logs
kubectl port-forward deployment/kibana-kibana 5601 -n logging
Now perform following steps to get index configured
- Go to Management → Kibana → Index Patterns page, and click Create index pattern. Kibana will automatically identify and display the Filebeat index:
- Enter ‘filebeat-’ and on the next step select the @timestamp* field to finalize the creation of the index pattern in Kibana.
- Hop on over to the Discover page. You’ll see all the metrics being collected from your Kubernetes cluster by Filebeat displayed:
Checkout following repository to learn more: github.com/ashishkamat2791/spring-minikube-..